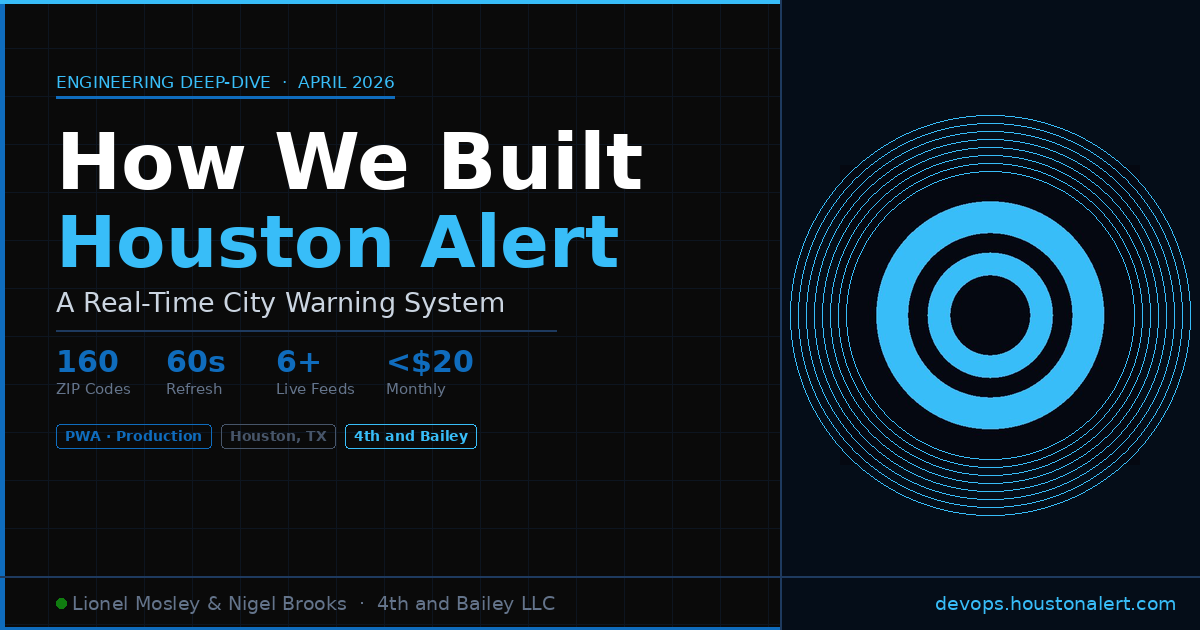
01 Houston Has a Real Infrastructure Problem
Living in the Greater Houston area for quite some time, we've watched the city flood, lose power, and sit in hours of standstill traffic — often all at the same time. What struck us wasn't the severity of the events themselves, but how poorly that information traveled to the people who needed it most.
During major weather events, Houstonians would frantically refresh social media, call relatives, and listen to the radio just to find out if their street was passable. Government alert channels were siloed. News coverage was reactive. There was no single place that pulled it all together in real time.
We didn't want to build another weather app. We wanted to build the tool that would have helped our neighbors during Harvey, during the February freeze, during every flood season since.
— Lionel Mosley, Co-AuthorHarris County averages over 50 inches of rain per year. Flood events can become dangerous within minutes, yet residents often have no localized, real-time indication that their route is compromised. A flood alert from two hours ago is worse than no alert — it creates false confidence.
During the February 2021 winter storm, millions lost power for days. Utility outage maps were overwhelmed or offline. People needed a survivability layer, not just a weather advisory.
Houston has one of the most complex highway systems in the United States. A single accident on I-10 or the Katy Freeway can cascade into hours of gridlock — with no aggregate view of the full picture available to residents.
Emergency alerts lived across TxDOT dashboards, NWS feeds, county flood warnings, and 311 systems — none of them talking to each other, all requiring separate monitoring by an individual citizen.
02 Why 4th and Bailey Decided to Build It
Nigel and I had been working together on data infrastructure projects for roughly a year before Houston Alert became a real conversation. The idea crystallized during a weekend in early 2025 when a water main break near Midtown created a three-hour traffic situation that we only learned about after we were already sitting in it.
We asked ourselves: all of this data is public. Government agencies publish it. Stream gauges are online. Road incident APIs exist. Social platforms surface real-world events within minutes. Why is nobody stitching it together for Houston residents?
The answer was that it's technically non-trivial to do well. Merging heterogeneous data sources with different schemas, refresh rates, coordinate systems, and reliability characteristics requires genuine engineering effort. That's exactly the kind of problem we enjoy. We started prototyping the same weekend.
Three non-negotiables before writing a line of code
03 The System We Designed
We'll talk about principles and patterns here rather than naming specific vendor products — this architecture is intentionally portable and the structural decisions matter more than the specific tooling.
Key architectural decisions
We chose an in-memory store with a 6-hour TTL and a 2,000-event cap over a traditional database. For a real-time feed, write latency matters more than persistence. Events older than 6 hours are no longer actionable — stale data misleads.
Not all government APIs support webhooks. Scheduled polling on a tight cycle was the only reliable cross-source architecture. We run pollers every 60 seconds for most sources, with a 5-minute cycle for sources with stricter rate limits.
The same road incident can appear in multiple sources simultaneously. Our deduplication engine uses deterministic ID generation — identical events from different sources produce the same hash, preventing the map from clustering duplicate pins.
Official government sources receive verified status. Social signals are weighted by post volume, keyword specificity, and geographic precision. The UI surfaces this as a confidence percentage so users can assess source quality at a glance.
04 Six Feeds. One Coherent Picture.
Every data source we integrated required custom handling. Different schemas, different coordinate formats, different reliability profiles, different authentication models.
The most interesting engineering problem wasn't fetching the data. It was building a trust model that lets a citizen distinguish between a verified TxDOT closure and an unconfirmed community report — at a glance, under stress.
— Nigel Brooks, Co-Author-
Houston TranStar — Road & TrafficThe regional traffic management authority for the Houston metro. TranStar operates 24/7 and monitors incident data from freeway sensors, cameras, and law enforcement dispatch. Our highest-trust source for accident and lane-closure events.
-
TxDOT — Construction & Lane ClosuresTexas Department of Transportation publishes construction activity through ArcGIS REST endpoints. Construction zones significantly affect routing on major arteries like I-10, 290, and the Beltway, and they change frequently.
-
National Weather Service — Weather AlertsNWS publishes active warnings, watches, and advisories via a public REST API with polygon coverage areas. We filter for Harris, Fort Bend, Galveston, Brazoria, Montgomery, and Waller counties. During severe weather we drop to a 30-second polling cycle.
-
Harris County FWS — Stream GaugesHCFWS operates a network of stream gauges across Harris County bayous and creeks. We pull gauge readings via the USGS National Water Information System and map them against flood stage thresholds to surface at-risk waterways in real time.
-
USGS Earthquake Catalog — Seismic ActivityThe Gulf Coast region has experienced induced seismicity events in recent years. We monitor the USGS earthquake catalog for events within the Houston bounding box, providing early awareness of ground-motion events that may affect infrastructure.
-
Social Signal Layer — Community ReportsReal-world events appear on social platforms before official sources acknowledge them. We ingest recent posts filtered to Houston geography and run keyword classification across 8 incident categories — from flooding and power outages to gas leaks and structural damage.
05 What Actually Took Time
Cross-source event deduplication at scale
The same freeway accident shows up in TranStar, TxDOT, the social layer, and sometimes NWS in rapid succession. Naive deduplication by title string failed on minor text variations. Coordinate-radius deduplication failed across sources with different precision.
We moved to deterministic ID generation using a hash of the event's canonical location bucket, category, and source-type. Events within 300 meters of the same category from any source resolve to the same ID and are merged rather than duplicated. The UI shows the highest-trust source for any merged event.
iOS Safari touch event routing failure
On iPhones and iPads, backdrop-filter CSS on overlay elements caused iOS's Metal compositor to misroute touch events to the map layer beneath, making every button in the interface unresponsive. This was extremely difficult to reproduce in emulation — it only appeared on physical devices.
We stripped backdrop-filter from all overlay elements on viewports under 900px, replacing with high-opacity solid backgrounds that are visually identical. We also removed filter from map tile layers at mobile breakpoints, which was creating additional compositor layers that worsened the hit-testing issue.
Map readability during mass-event weather
During a major storm we could receive 200+ concurrent events all within the same metropolitan area. An unmanaged map becomes an unusable cluster of pins that conveys no meaningful information.
We implemented geographic clustering with dynamic radii — clusters tighten at low zoom and expand at high zoom, displaying event counts. Clicking a cluster either zooms to reveal it or spiderfies tightly-packed events. High-severity events break out of clusters at lower zoom levels than routine incidents.
Keeping infrastructure costs near zero
A platform that goes viral during a hurricane could receive 50,000 concurrent users. We couldn't absorb unpredictable cloud compute costs for a free public service with no monetization model.
The frontend is fully static — no server-side rendering, no compute on page loads. All the intelligence lives in the backend scheduler that runs continuously at low cost. API responses are small JSON payloads. Map tiles are served from a CDN-backed public tile provider. Our total monthly infrastructure cost for a production deployment is under $20.
06 Why We Built a PWA, Not a Native App
This was a deliberate and consequential architectural choice. A native app requires installation friction, review cycles, and ongoing maintenance across platform versions. A PWA requires none of that — it's a URL you share, a bookmark on your home screen, and a notification permission if the user consents.
For an emergency information tool, zero installation friction is not a nice-to-have — it's a core safety feature. During a hurricane, you don't wait for an app to download. You send someone a link and they're looking at real-time data within seconds.
// Web App Manifest — enables home screen install + splash screen
{
  "name": "Houston Alert",
  "short_name": "Houston Alert",
  "description": "Real-time infrastructure alerts · 160 Houston ZIP codes",
  "start_url": "/",
  "display": "standalone",
  "background_color": "#f5f5f5",
  "theme_color": "#0f6cbd",
  "orientation": "any",
  "icons": [
    { "src": "/icons/icon-192.png", "sizes": "192x192", "type": "image/png" },
    { "src": "/icons/icon-512.png", "sizes": "512x512", "type": "image/png" }
  ]
}
07 What's Next
08 Built by Two Engineers Who Call Houston Home
4th and Bailey exists to build things that matter in the communities we're part of. Houston Alert isn't a side project. It's an obligation.
— Lionel Mosley & Nigel Brooks · 4th and Bailey LLC